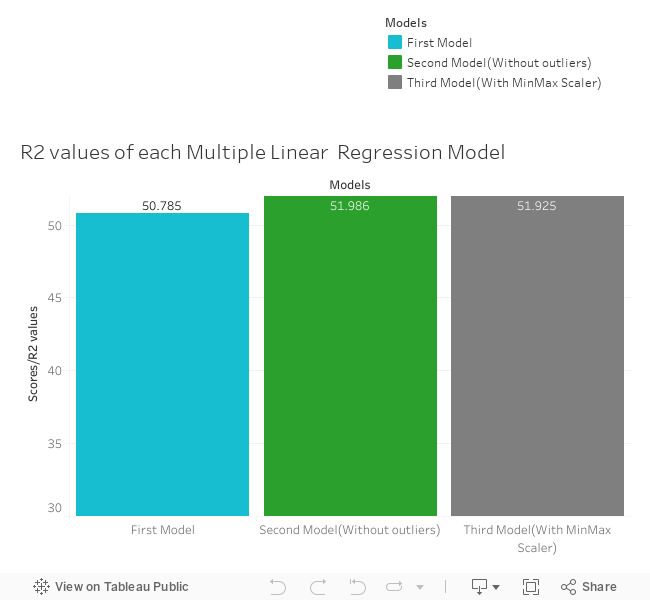
We started by creating a Multiple Linear Regression model on the full data set (including
the height outliers). For this first model, we calculated an R2 value of 50.785%.
This indicates that our model accounts for about half of the variance in the data set.
We then created a second Multiple Linear Regression model on a data set that excludes the
four height outliers that were found in the Visualizing Parameters stage. This model produced
an R2 value of 51.986%. This is indicates that removing the four outliers improved the
model's performance.
Because the data are all positive, we next tried using the Min-Max Scaler from SciKit-Learn
instead of the Standard Scaler. This resulted in an R2 value of 51.952%. Since it
did not produce an appreciable improvement in the model's performance, we returned to using
the Standard Scaler for the rest of the non-neural network models.
Since we weren't obtaining strong R2 values with the linear regression models, we
decided to try other types of supervised regression models.